
Koscom NAV and iNAV
The net asset value of an ETF is computed by dividing the total value of the ETF’s underlying assets by the number of outstanding shares:
\[\text{nav} = {\text{cash} + \sum \text{assets} \over \text{number of oustanding shares}}\]The calculation is quite easy but getting the right data can be a hassle. In this post, we go over how to calculate the net asset value of
Data and parameters
We will calculate the net asset value of KODEX KOSPI200 ETF (KR7069500007) that tracks KOSPI200 index and KODEX KOSDAQ150 ETF (KR7229200001) that tracks KOSDAQ150 index on May 26, 2023.
In our database, we have the following tables (and interface id):
- KrxETFNAV (BV03S): contains ETF net asset value messages that is sent by Koscom.
- KrxETFPDF (F803S): contains the portfolio deposit file (or portfolio composition file)
- KrxStockBatchData (IFMSBTD0001): contains stock batch data messages where each message contains information of a security traded at KRX
- KrxStockMarketdepth (IFMSRPD0002): contains stock marketdepth data, we are only interested in best ask and best bid price/quantity.
ETF PDF data
ETF’s portfolio deposit file message get disseminated in the morning before the market opens (it is sent twice, one at 6:00 and the next at 7:00). We are interested in KODEX KOSDAQ150 ETF’s pdf which we can find sending the following query to our clickhouse database:
SELECT DISTINCT ON (component_isin)
   component_isin
   , securities_per_1_cu_or_contract_units_or_korean_won_cash
   , par_value_or_initial_cash_amount
   , valuation_amount
   , toTimeZone(system_datetime, 'Asia/Seoul') as system_datetime
FROM default.KrxETFPDF
WHERE
    isin='KR7229200001'
    AND toDate(system_datetime, 'Asia/Seoul')='2023-05-26'
ORDER BY component_isin
This query will return a table that looks like the following:
	component_isin	securities_per_1_cu_or_contract_units_or_korean_won_cash	par_value_or_initial_cash_amount	valuation_amount	system_datetime
0	KR7000250001	7300.0	0.0	4577100.0	2023-05-26 07:07:11.751923396+09:00
1	KR7003100005	1400.0	0.0	367500.0	2023-05-26 07:07:11.782741794+09:00
2	KR7003380003	20400.0	0.0	1750320.0	2023-05-26 06:27:11.556796744+09:00
3	KR7005290002	18100.0	0.0	6452650.0	2023-05-26 06:27:11.587258894+09:00
4	KR7006730006	14200.0	0.0	1079200.0	2023-05-26 06:27:11.617790990+09:00
5	KR7007390008	26500.0	0.0	2806350.0	2023-05-26 06:27:11.648251013+09:00
6	KR7015750003	24800.0	0.0	2480000.0	2023-05-26 06:27:11.678772217+09:00
7	KR7016790008	11500.0	0.0	3588000.0	2023-05-26 07:07:11.966518570+09:00
8	KR7022100002	26800.0	0.0	3130240.0	2023-05-26 07:07:11.997238082+09:00
9	KR7023410004	23100.0	0.0	820050.0	2023-05-26 07:07:12.027744952+09:00
10	KR7025900002	2300.0	0.0	1104000.0	2023-05-26 06:27:11.800727598+09:00
11	KR7025980004	30900.0	0.0	1918890.0	2023-05-26 07:07:12.088699514+09:00
12	KR7027360007	23900.0	0.0	579575.0	2023-05-26 06:27:11.862013942+09:00
13	KR7028300002	57700.0	0.0	20598900.0	2023-05-26 06:27:11.892536047+09:00
14	KR7029960002	11000.0	0.0	811800.0	2023-05-26 06:27:11.923032848+09:00
15	KR7030190003	17900.0	0.0	1909930.0	2023-05-26 06:27:11.953537584+09:00

...
On May 26 2023, there are 152 components in the KODEX KOSDAQ150 ETF. To compute the net asset value of the ETF, we sum the valuation amount column and divide it by the creation unit. For KODEX KOSDAQ150 ETF, the creation unit is 50000:
nav = np.sum(df["valuation_amount"]) / 50000 # 12793.0077
The resulting nav matches the official previous day nav disseminated by Koscom. We can check the correctness of the valuation amount by taking the previous closing price of each stock and multiplying it to the number securities per 1 cu column value:
etf_pdf = EtfPdf(etf_isin, date_str, etf_cu, tz)
etf_batchdata = StockBatchData([etf_isin], date_str, tz)
etf_intraday_nav = EtfIntradayNav(etf_isin, date_str, tz)
assert etf_pdf.nav - etf_intraday_nav.prev_day_nav < 1e-2, f"diff: {etf_pdf.nav - etf_intraday_nav.prev_day_nav}"
The class functions EtfPdf, StockBatchData, EtfIntradayNav are provided in the attached file. When running the above code, we see that all the valuation amounts match our calculated valuation amounts.
Marketdepth data for component stocks
Koscom disseminates nav data of every ETF every second, and more importantly, the first nav message is sent at ‘09:00:10’. For HFT firms, this is a potential arbitrage opportunity. We can compute intraday NAV of an ETF from individual stock quotes. In order to do that, we need to get the marketdepth data of all component stocks and update our nav:
WITH stock_marketdepth AS (
    SELECT
        isin,
        l1askprice,
        l1asksize,
        l1bidprice,
        l1bidsize,
        (l1askprice + l1bidprice) / 2 AS midprice,
        (l1askprice * l1bidsize + l1bidprice * l1asksize) / (l1asksize + l1bidsize)
           AS weighted_midprice,
        toDate(system_datetime, 'Asia/Seoul') as date,
        toTimeZone(system_datetime, 'Asia/Seoul') as system_datetime,
        'KR7229200001' as etf_isin
    FROM default.KrxStockMarketdepth
    WHERE
        toDate(system_datetime, 'Asia/Seoul')='2023-05-26'
        AND
        toTime(system_datetime, 'Asia/Seoul') BETWEEN
            toTime(parseDateTimeBestEffort('09:00:01.0', 'Asia/Seoul'), 'Asia/Seoul')
            AND
            toTime(parseDateTimeBestEffort('15:19:59.0', 'Asia/Seoul'), 'Asia/Seoul')
        AND isin in ({",".join([f"'{isin}'" for isin in isins])})
    ORDER BY system_datetime
)
, nav AS (
    SELECT
        isin
        , previous_day_nav / 100 as prev_day_nav
        , intraday_final_nav / 100 as intraday_final_nav
        , toTimeZone(system_datetime, 'Asia/Seoul') as system_datetime
    FROM default.KrxETFNAV
    WHERE isin='KR7229200001'
    AND toDate(system_datetime, 'Asia/Seoul')='2023-05-26'
    ORDER BY system_datetime ASC
)
SELECT
    stock_marketdepth.*
    , nav.prev_day_nav
    , nav.intraday_final_nav
FROM stock_marketdepth
ASOF LEFT JOIN nav
ON stock_marketdepth.etf_isin = nav.isin
AND stock_marketdepth.system_datetime >= nav.system_datetime
ORDER BY system_datetime
Note that we used python to run this query since it is cumbersome to write down all 152 isins that are in KODEX KOSDAQ150 ETF. The result of the query will look something like this:
isin	l1askprice	l1asksize	l1bidprice	l1bidsize	midprice	weighted_midprice	date	system_datetime	etf_isin	prev_day_nav	intraday_final_nav
10000	KR7041510009	104100.0	58	104000.0	28	104050.0	104032.558140	2023-05-26	2023-05-26 09:01:01.829710847+09:00	KR7229200001	12793.01	12844.34
10001	KR7060720000	20550.0	935	20500.0	100	20525.0	20504.830918	2023-05-26	2023-05-26 09:01:01.841332664+09:00	KR7229200001	12793.01	12844.34
10002	KR7052020005	19270.0	193	19260.0	78	19265.0	19262.878229	2023-05-26	2023-05-26 09:01:01.855721867+09:00	KR7229200001	12793.01	12844.34
10003	KR7067310003	17310.0	530	17300.0	10406	17305.0	17309.515362	2023-05-26	2023-05-26 09:01:01.862351680+09:00	KR7229200001	12793.01	12844.34
10004	KR7067630004	10920.0	30	10890.0	95	10905.0	10912.800000	2023-05-26	2023-05-26 09:01:01.864752235+09:00	KR7229200001	12793.01	12844.34
10005	KR7058470006	126700.0	573	126600.0	321	126650.0	126635.906040	2023-05-26	2023-05-26 09:01:01.874548800+09:00	KR7229200001	12793.01	12844.34
10006	KR7074600008	26600.0	662	26500.0	925	26550.0	26558.286074	2023-05-26	2023-05-26 09:01:01.876554644+09:00	KR7229200001	12793.01	12844.34
10007	KR7078340007	67900.0	200	67800.0	20	67850.0	67809.090909	2023-05-26	2023-05-26 09:01:01.881207917+09:00	KR7229200001	12793.01	12844.34
10008	KR7061970000	8030.0	902	8020.0	30	8025.0	8020.321888	2023-05-26	2023-05-26 09:01:01.884060829+09:00	KR7229200001	12793.01	12844.34
10009	KR7064260003	4285.0	161	4275.0	252	4280.0	4281.101695	2023-05-26	2023-05-26 09:01:01.886363998+09:00	KR7229200001	12793.01	12844.34
Now we are ready to calculate intraday nav.
Calculating intraday nav
To compute inav, we update the price of the stock whenever a message that contains an orderbook data of ETF’s component stock comes in. Using the query result from above, we can write the following python code:
tz = "Asia/Seoul"
beg_date_pd = pd.to_datetime("2023-05-26").tz_localize(tz).date()
end_date_pd = pd.to_datetime("2023-05-26").tz_localize(tz).date()
beg_time = "09:00:01.0"
end_time = "15:19:59.0"

etf_isin = 'KR7229200001'  # kosdaq150, 'KR7069500007' for kospi200
etf_cu = 50000

for date in pd.date_range(beg_date_pd, end_date_pd):
    date_str = date.strftime("%Y-%m-%d")
    print(date_str)

    # check if the date is a trading date, if not continue
    if not is_trading_date(date_str):
        continue

    # get pdf data
    etf_pdf = EtfPdf(etf_isin, date_str, etf_cu, tz)
    etf_batchdata = StockBatchData([etf_isin], date_str, tz)
    etf_intraday_nav = EtfIntradayNav(etf_isin, date_str, tz)
    assert etf_pdf.nav - etf_intraday_nav.prev_day_nav < 1e-2, f"diff: {etf_pdf.nav - etf_intraday_nav.prev_day_nav}"

    component_marketdepth = MarketdepthWithNavData(
        etf_pdf.component_isins,
        etf_isin,
        date_str,
        beg_time, end_time, tz)

    inav = []
    for k, row in enumerate(component_marketdepth):
        koscom_nav = row["intraday_final_nav"] if row["intraday_final_nav"] > 0 else etf_intraday_nav.prev_day_nav
        etf_pdf.update_state(
            row["isin"],
            row["weighted_midprice"],
            koscom_nav,
            row["system_datetime"]
        )
        inav.append((
                etf_pdf.updated_datetime,
                etf_pdf.nav,
                etf_pdf.koscom_nav,
                etf_pdf.nav - etf_pdf.koscom_nav))


df = pd.DataFrame(inav, columns=["updated_datetime", "nav", "koscom_nav", "diff"])
df.plot(
    x="updated_datetime",
    y=["nav", "koscom_nav"],
    figsize=(30, 10),
    grid=True
)

df.plot(
    x="updated_datetime",
    y=["diff"],
    figsize=(30, 10),
    grid=True
)
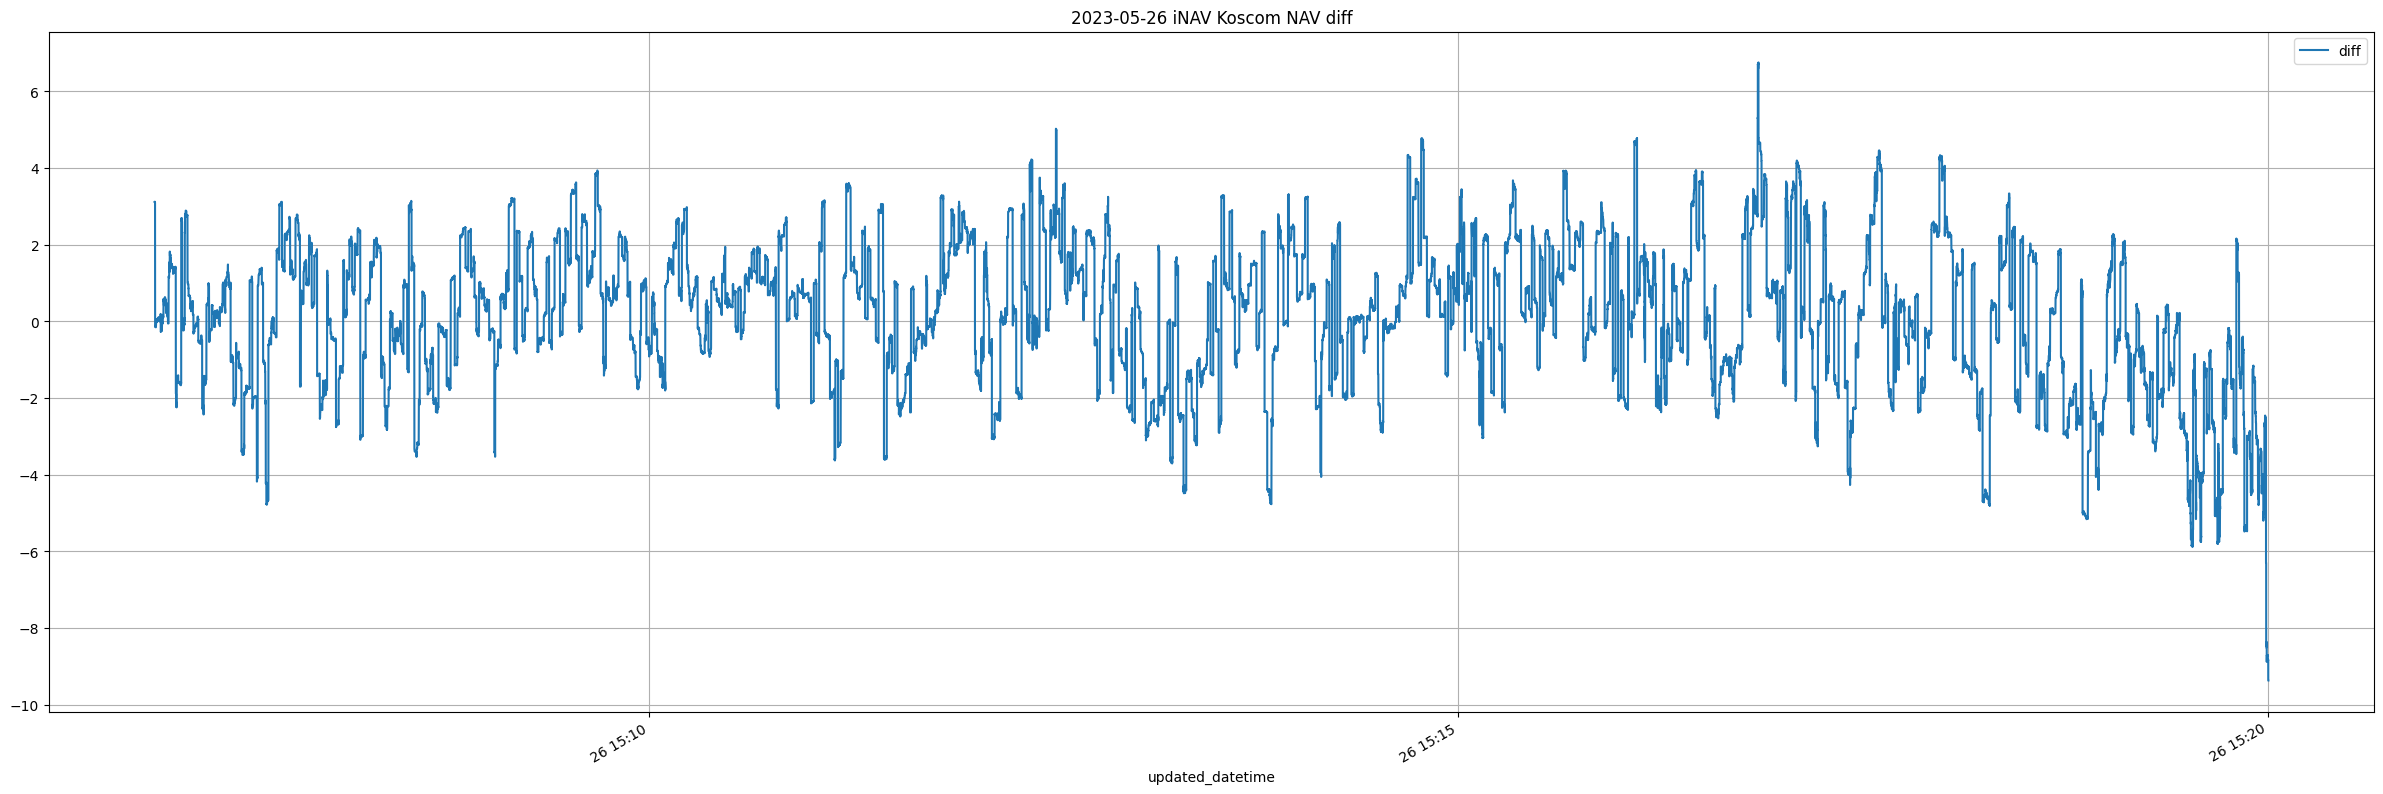
The resulting plots are shown below:
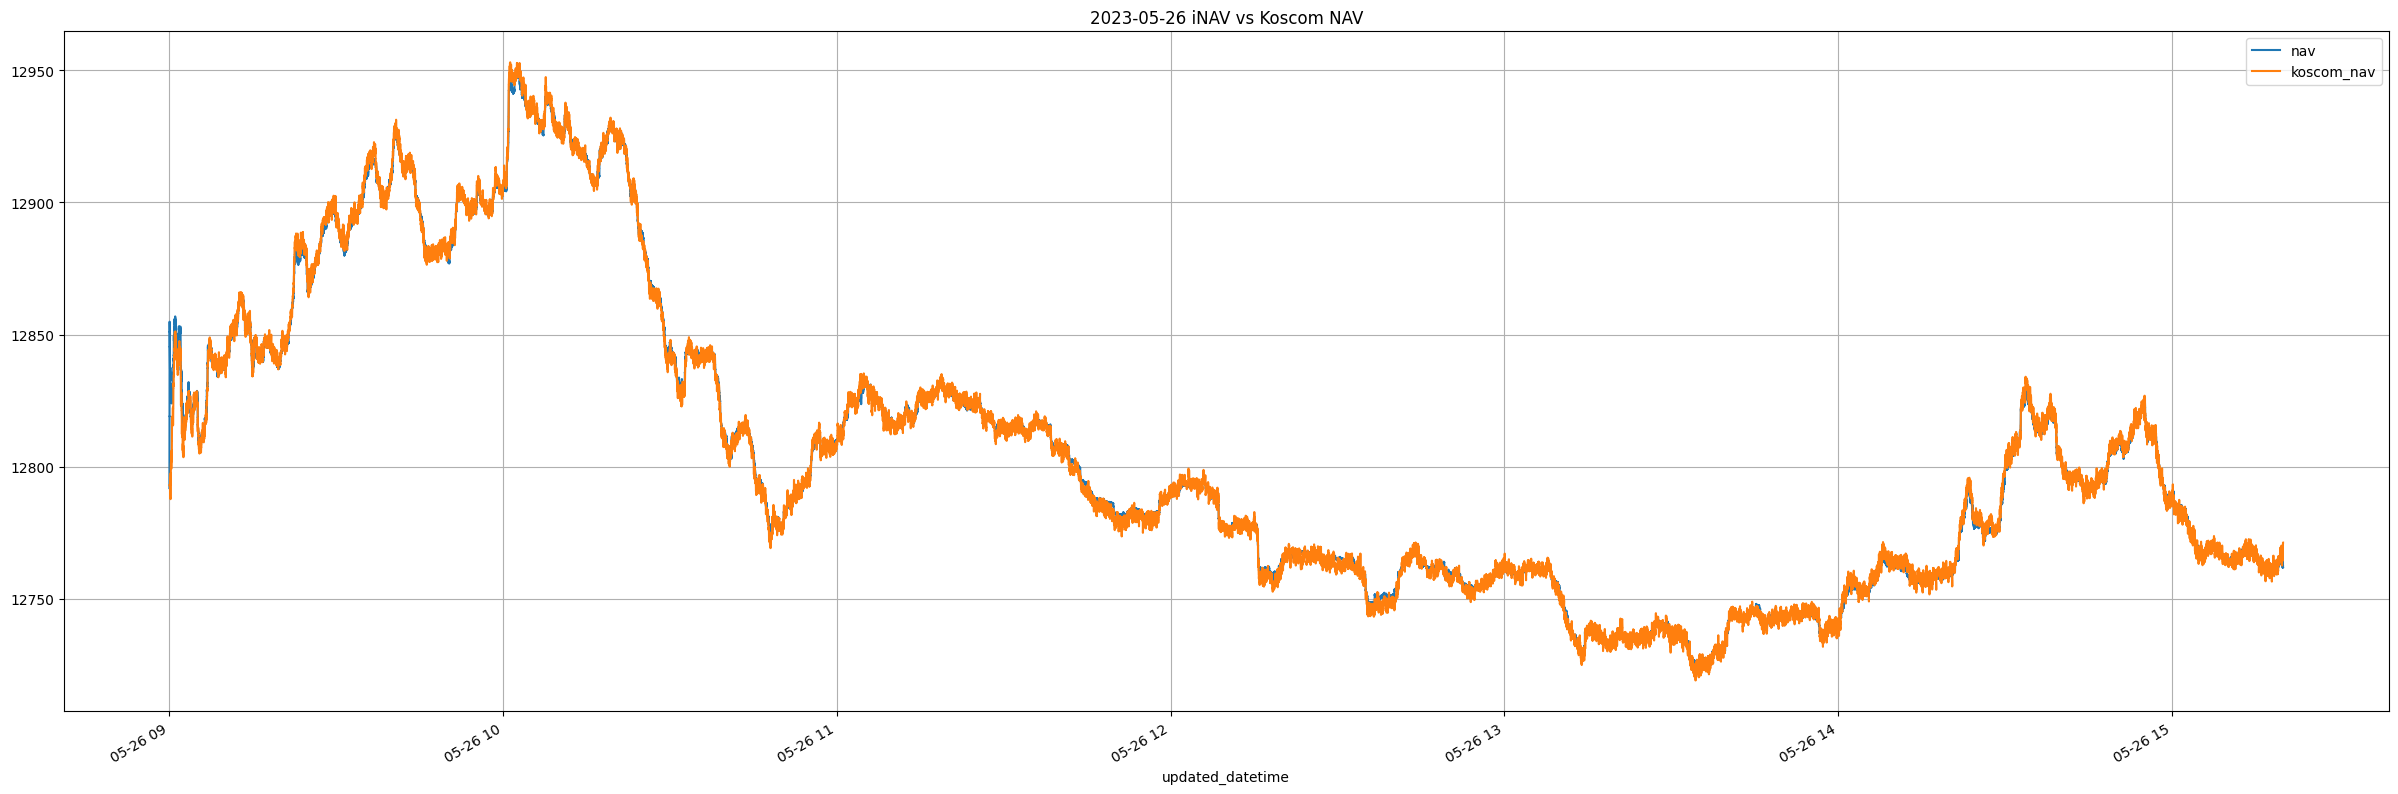
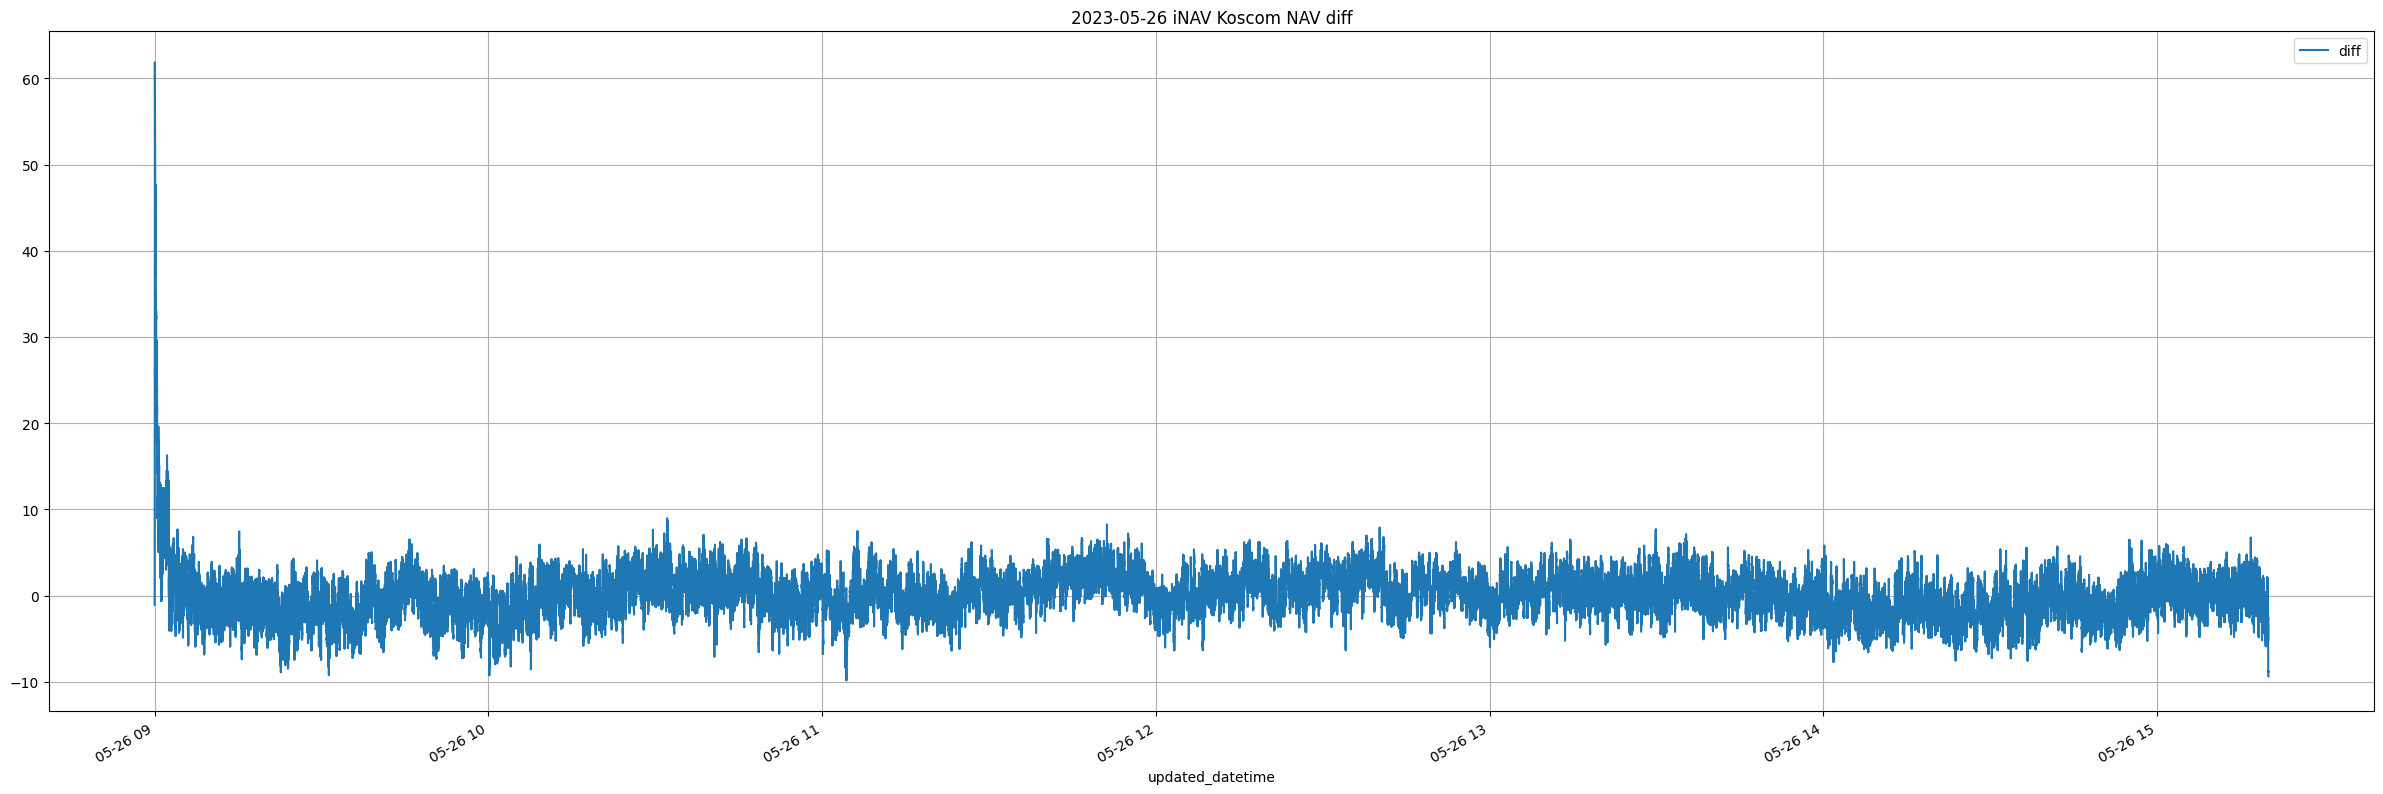
The plot indicates that divergence in nav values occur mostly in the morning. Throughout the day, the nav values converge pretty well. Let’s look at iNav and Koscom NAV more closely in the morning:
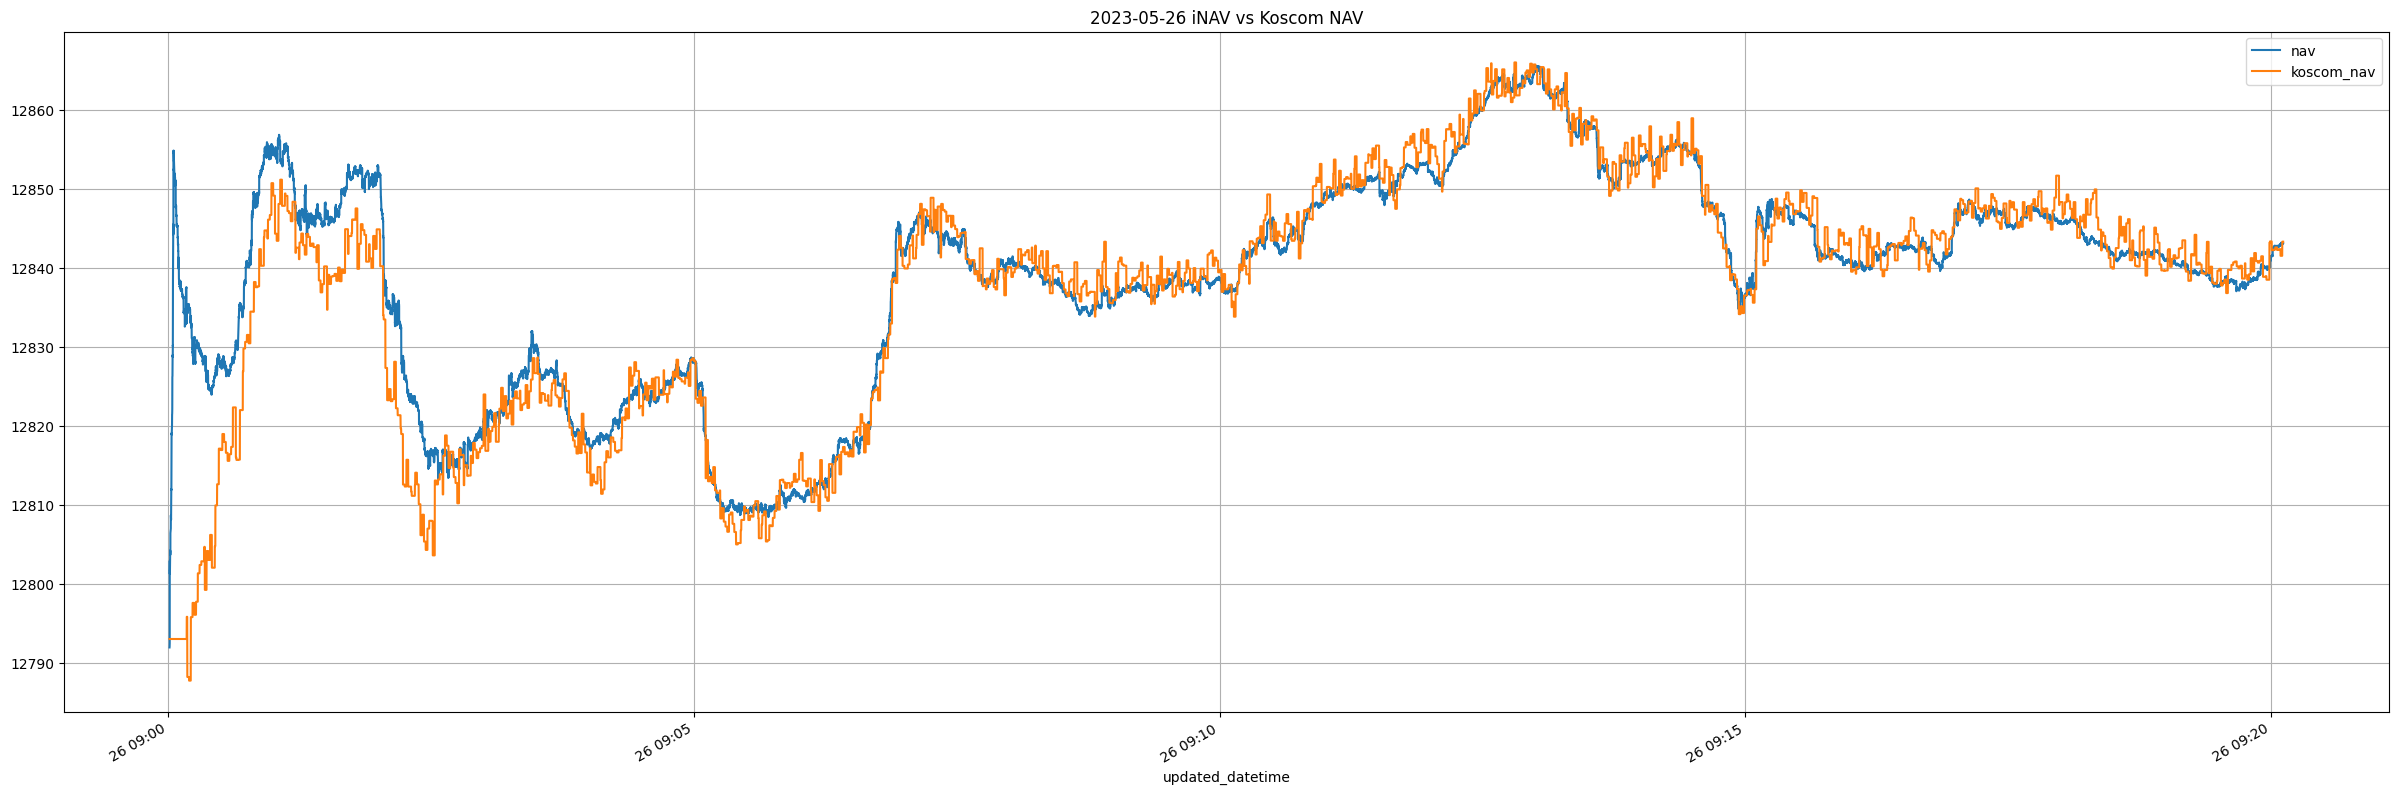
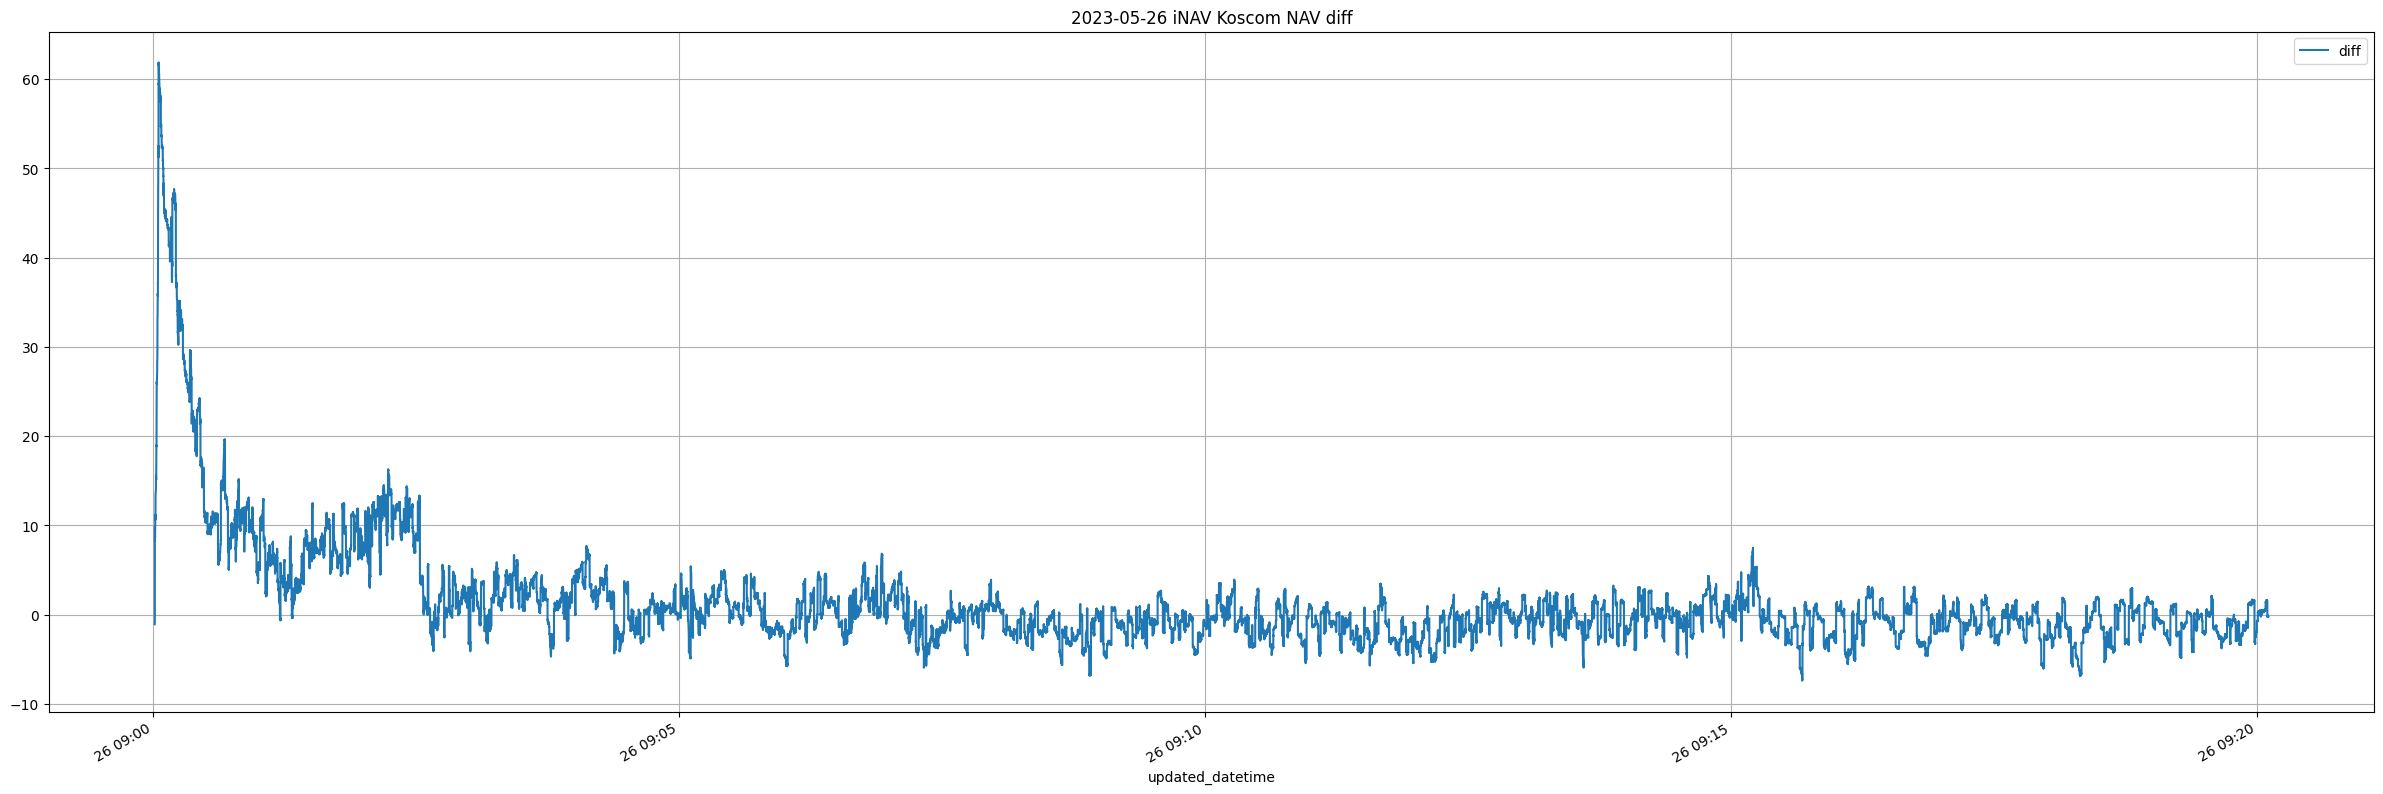
We see that in the first 5 minutes of trading hours, the nav value from Koscom has a hard time keeping track of our inav. However, after 09:05:00.0, things start to settle and we see that inav and koscom nav values converge nicely.
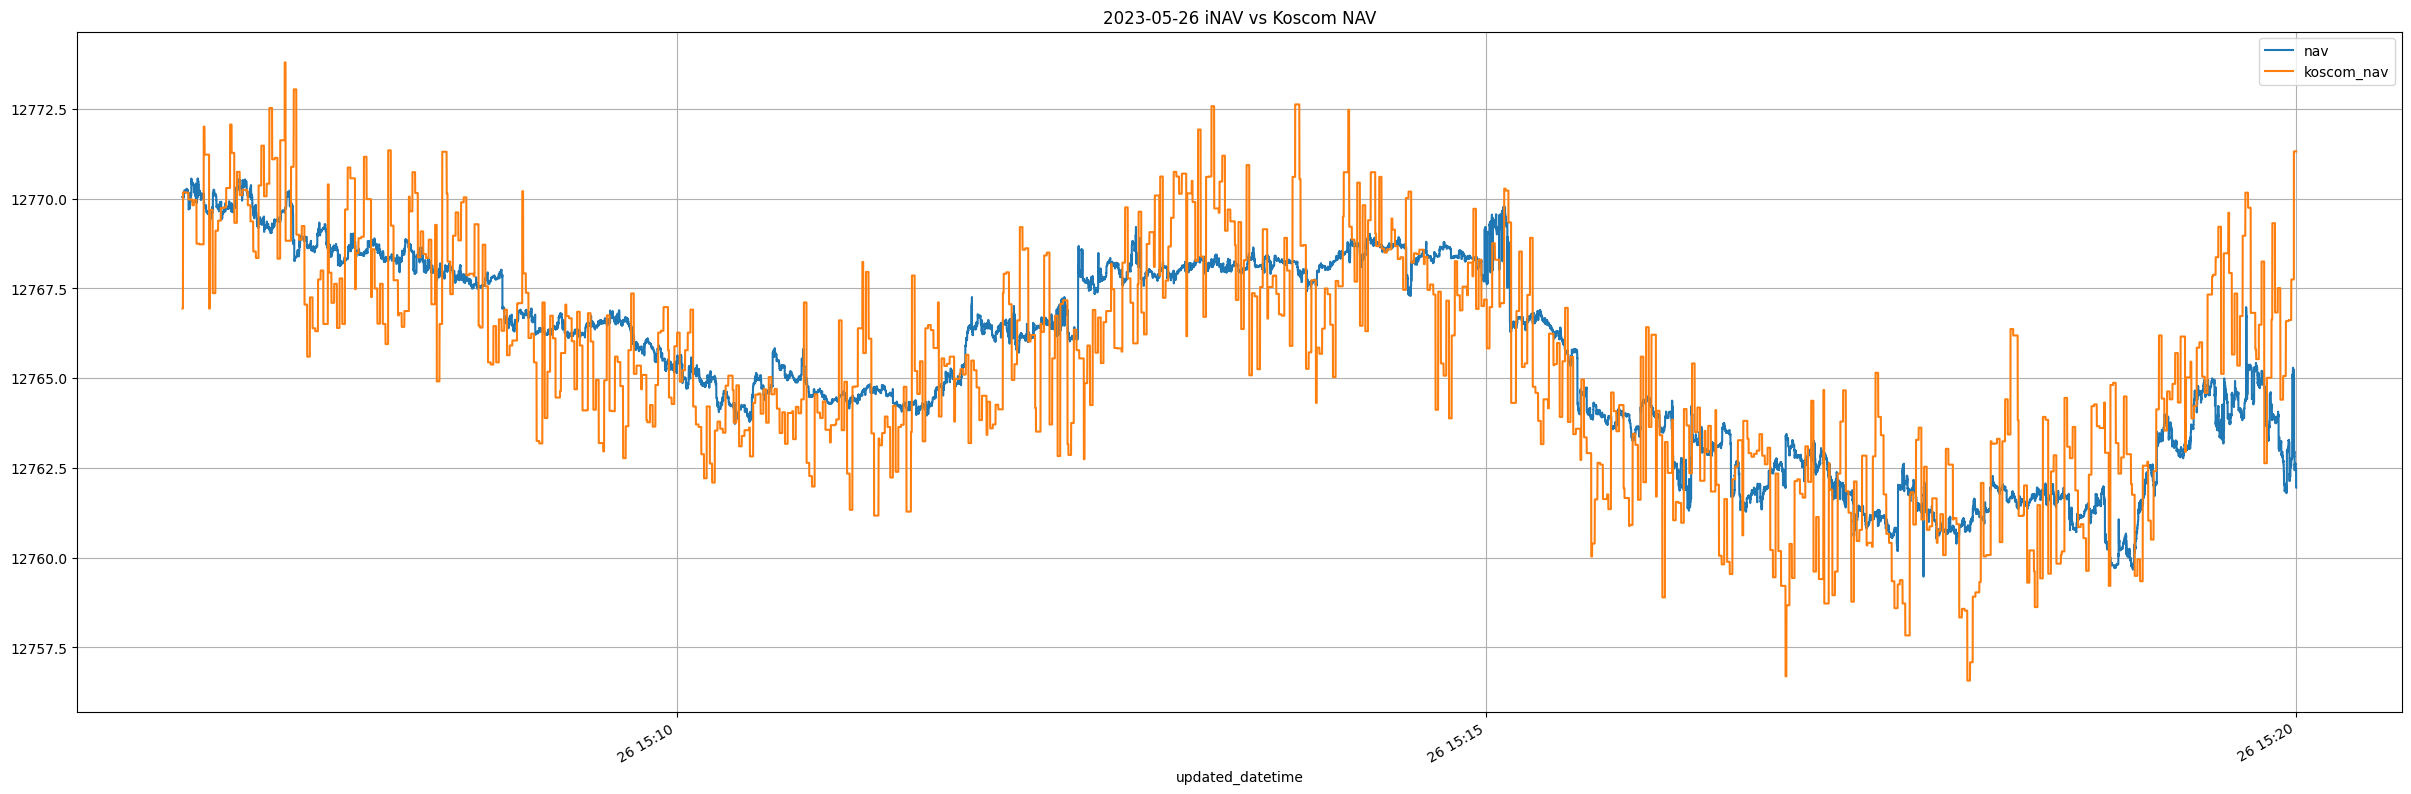
Above are inav and koscom nav before market close.
Leave a comment