
ELW and implied volatility (IV)
There are no individual stock options in the Korean stock exchange, a stark contrast to the US market. However, Korean financial firms provide a product called ELW which is almost identical to individual stock options. Hence we will treat ELW like options and generate a volatility curve from both call and put ELWs. In this post, we will deal with ELW products that track KOSPI200 index. Unfortunately, we do not have intraday KOSPI200 index data so we will use KOSPI200 futures price data instead. This is obviously not correct but it still generates a nice volatility curve which is the main goal of this post.
Creating an ELW chain
ELW products are provided by financial firms and an ELW product with the same strike price and maturity can be issued by multiple financial firms. Here we will only focus on ELW products from an investment firm called the Korean investment & securities (한국투자증권). Their ELW products come with a KIS prefix which we will use in query pattern matching.
Just like an option chain, we need to create an ELW chain. We first need to collect ELW at different strike prices and maturity dates. We can do this by running the following query:
SELECT DISTINCT ON (abbreviated_issue_code, exercising_period)
    isin
    , base_price
    , prev_day_closing_price
    , prev_day_accumulated_trading_amount
    , main_board_unit_volume
    , abbreviated_issue_name_in_en
    , abbreviated_issue_code
    , exercising_period
    , elw_bw_exercise_price
    , date_diff('d',
        toDate(system_datetime, 'Asia/Seoul'),
        toDate(exercising_period, 'Asia/Seoul')
    ) AS days_to_maturity
    , toDate(system_datetime, 'Asia/Seoul') as date
FROM default.KrxStockBatchData
WHERE date='2023-05-26'
    AND abbreviated_issue_name_in_en like 'KIS%KOSPI200%C'
    AND prev_day_closing_price > 0
    AND elw_bw_exercise_price > 0
    AND security_group_id='EW'
ORDER BY elw_bw_exercise_price, prev_day_accumulated_trading_amount DESC

SELECT DISTINCT ON (abbreviated_issue_code, exercising_period)
    isin
    , base_price
    , prev_day_closing_price
    , prev_day_accumulated_trading_amount
    , main_board_unit_volume
    , abbreviated_issue_name_in_en
    , abbreviated_issue_code
    , exercising_period
    , elw_bw_exercise_price
    , date_diff('d',
        toDate(system_datetime, 'Asia/Seoul'),
        toDate(exercising_period, 'Asia/Seoul')
    ) AS days_to_maturity
    , toDate(system_datetime, 'Asia/Seoul') as date
FROM default.KrxStockBatchData
WHERE date='2023-05-26'
    AND abbreviated_issue_name_in_en like 'KIS%KOSPI200%P'
    AND prev_day_closing_price > 0
    AND elw_bw_exercise_price > 0
    AND security_group_id='EW'
ORDER BY elw_bw_exercise_price, prev_day_accumulated_trading_amount DESC
When we collect all the isins for ELW call options, we get 255 ELW products and for put options we get 239 ELW products issued by Korea Investment & Securities:
call 255 ['KRA5731CCCB7', 'KRA5731ETD12', 'KRA5731L9C73', 'KRA5731CWCB5', 'KRA5731L8C74', ...]
put 239 ['KRA5732GBCA0', 'KRA5732FGCA1', 'KRA5732G7CA8', 'KRA5732G5CA2', ...]
Underlying asset data
In addition to ELW data, we need to get the underlying asset data. In KRX, they also disseminate ELW batch data messages in the morning before regular trading hours. We can get the underlying asset data using the following query:
SELECT DISTINCT ON (isin)
    isin
    , underlying_asset_code1
    , underlying_asset_code2
    , underlying_asset_code3
    , underlying_asset_code4
    , asset_composition_ratio1
    , asset_composition_ratio2
    , asset_composition_ratio3
    , asset_composition_ratio4
    , intrinsic_price
    , conversion_rate
    , lp_holding_quantity
    , toDate(system_datetime, 'Asia/Seoul') as date
FROM default.KrxELWBatchData
WHERE
    isin='KRA5731CCCB7'
    AND date='2023-05-26'
Note that we can pick any isin from either call or put option isins we got from the previous query. The above query returns the isin of the underlying asset. However, in our case, the underlying asset codes are empty because our ELW product tracks the KOSPI200 index which is not a trade-able product. Therefore, we manually enter the underlying asset code which is ‘KR4101T60006’ which expires on in June 2023.
SELECT DISTINCT ON (isin)
    isin
    , base_price
    , previous_day_closing_price as prev_day_closing_price
    , abbreviated_issue_name_in_en
    , toDate(system_datetime, 'Asia/Seoul') as date
FROM default.KrxDerivativeBatchData
WHERE
    isin='KR4101T60006'
    AND date='2023-05-26'
Black-Scholes
In order to calculate the implied volatility, we first need to go over the famous Black-Scholes equation. We won’t go into the derivation of the equation but you can find it easily on the internet. Let us first define parameters for Black-Scholes:
- $S$: Underlying price (e.g. KOSPI200 futures contract price)
- $K: strike price (e.g. ELW strike price which is available in ELW batch data)
- $\sigma$: volatility
- $r$: continuously compounded risk free interest rate (on 2023-05-26, it is 3.75%)
- $q$: continuously compounded dividend yield (on 2023-05-26, it is set at 2%)
- $t$: time to expiration (note, this is % of year) Then, the call and put option price formulas are:
where $N(x)$ is the standard normal cdf function \(N(x) = {1 \over \sqrt{2\pi}} \int_{-\infty}^x e^{-t^2/2} dt.\)
In the real market, we know the price of call and put options but not the implied volatility. Hence we can solve the above equations in terms of $\sigma$. Unfortunately, implied volatility calculation does not have a closed form, hence we need to use an iterative approach. Note that vega (or derivative of black scholes price formula with respect to volatility $\sigma$) is an increasing function with respect to volatility:
\[V = {1 \over 100} S e^{-qt} \sqrt{t} N'(d_1).\]Therefore, for a given call(or put) option price, there exists a unique implied volatility. Using this observation, we can use iterative methods such as Newton-Raphson method to find the implied volatility.
However, Newton-Raphson method does not always converge and can give erroneous result for deep in the money options. Many academic research papers tried tackling this problem, the most notable being “Let’s be rational” by Peter Jackel. Here we use Jackel’s method to compute implied volatility. Fortunately, there is a python implementation of Jackel’s paper which we can install with pip.
pip3 install py_vollib
and in our python code, we can import it:
from py_vollib.black_scholes_merton.implied_volatility import implied_volatility
You can find the source code here, paper here and documentation here. Now we are ready to compute ELW volatility surface.
Implied Volatility
Given the previous day closing prices, strike prices, and ELW prices, we can create a volatility surface. Let call_df dataframe contain all call ELWs and put_df contain all put ELWs. Then for each ELW product, we can compute the implied volatility using py_vollib:
call_vol_surface = {}
for i, row in enumerate(call_df.itertuples()):
    maturity = days_between(row.date.strftime("%Y%m%d"), row.exercising_period)
    moneyness = row.elw_bw_exercise_price / underlying_asset_price
    try:
        sigma = implied_volatility(row.prev_day_closing_price,
                                   underlying_asset_price*conversion_rate,
                                   row.elw_bw_exercise_price * 100,
                                   maturity / 365,
                                   r, q, 'c')
    except:
        sigma = 0
    call_vol_surface[row.isin] = {
        "price": row.prev_day_closing_price,
        "exercise_price": row.elw_bw_exercise_price,
        "moneyness": moneyness,
        "maturity": maturity,
        "sigma": sigma
    }


put_vol_surface = {}
for i, row in enumerate(put_df.itertuples()):
    maturity = days_between(
                    row.date.strftime("%Y%m%d"),
                    row.exercising_period
                )
    moneyness = row.elw_bw_exercise_price / underlying_asset_price
    try:
        sigma = implied_volatility(row.prev_day_closing_price,
                                    underlying_asset_price*conversion_rate,
                                    row.elw_bw_exercise_price * 100,
                                    maturity / 365,
                                    r, q, 'p')
    except:
        sigma = 0
    put_vol_surface[row.isin] = {
        "price": row.prev_day_closing_price,
        "exercise_price": row.elw_bw_exercise_price,
        "moneyness": moneyness,
        "maturity": maturity,
        "sigma": sigma
    }
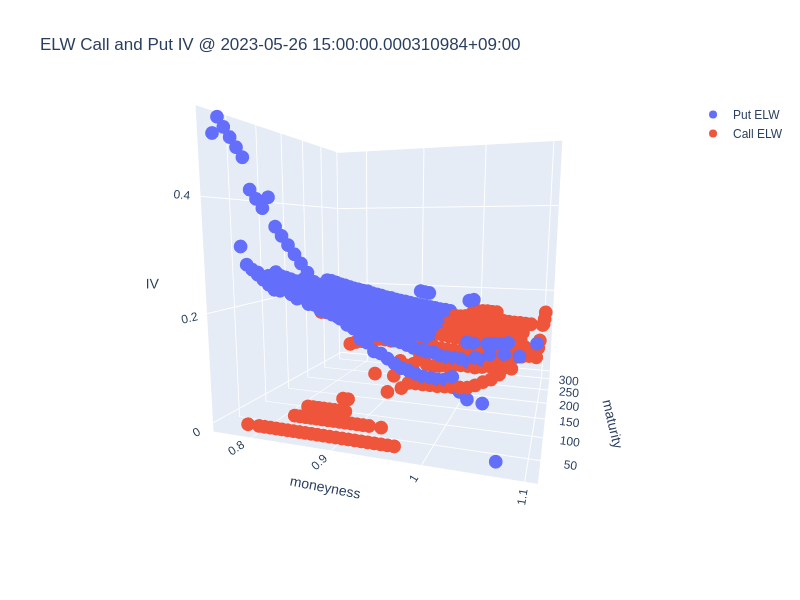
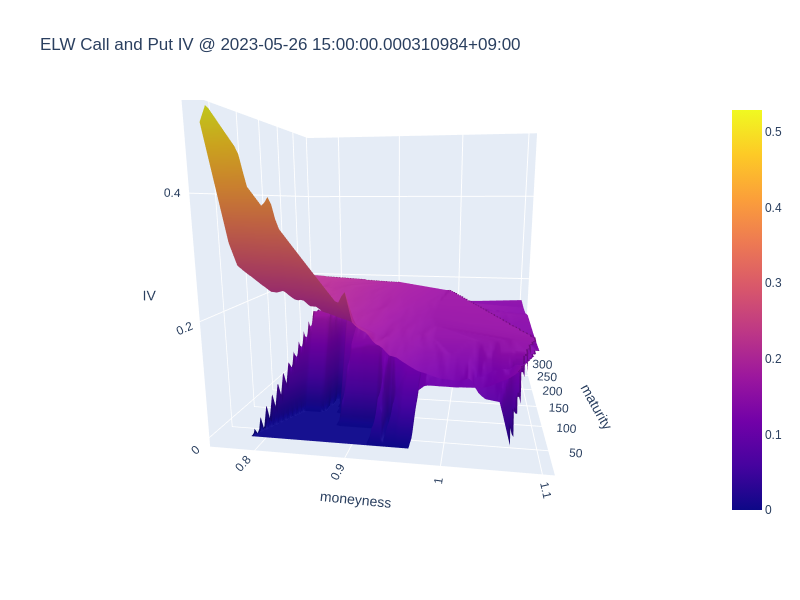
Plotting the above volatility surface, we get the following figures:
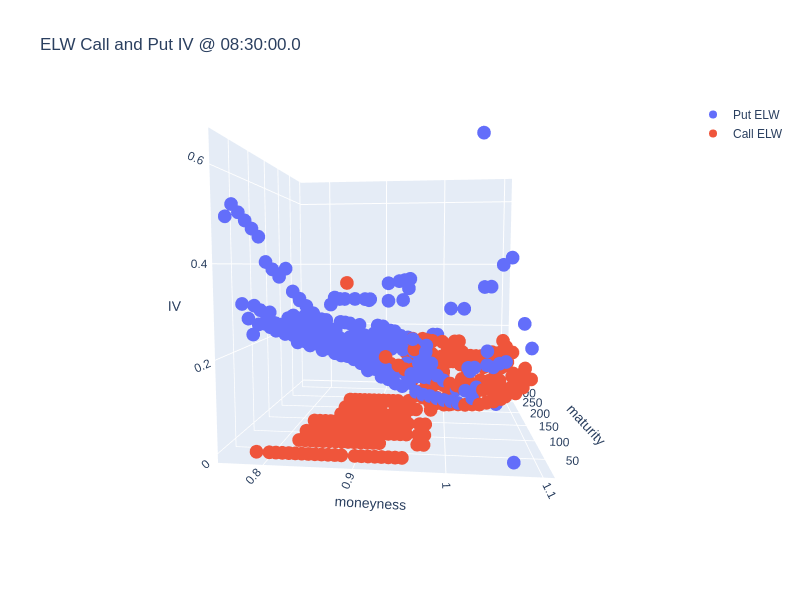
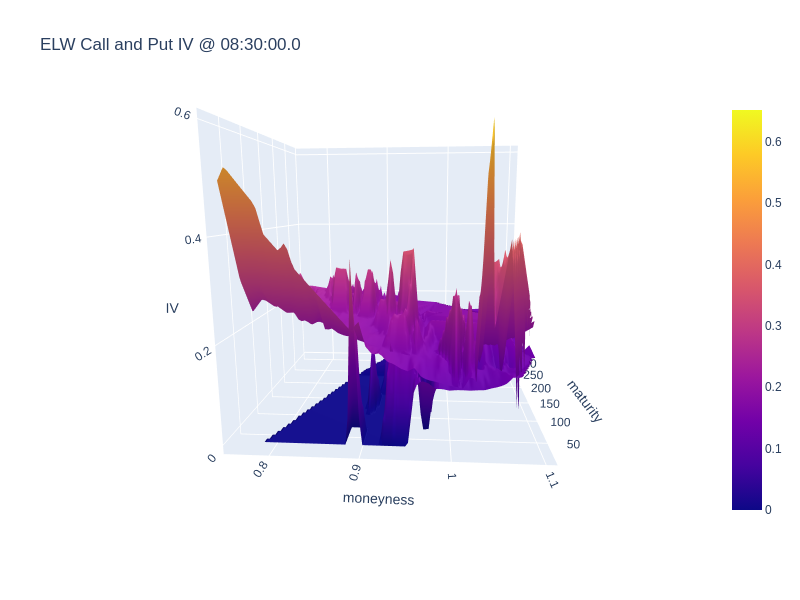
The resulting plot is not smooth due to missing moneyness-maturity points and untraded ELW securities; however, you can still see the volatility smile in both the scatter plot and the surface plot.
ELW and Underlying Asset Marketdepth
Implied volatility is a function of underlying asset price and maturity. If we are only trading using intraday market feed, then the only variable we need to be concerned with is the underlying asset price. Whenever the underlying asset price changes, we can update our volatility surface to get the most up-to-date state. In order to do so, we first need to get market depth data of all of our ELW products in addition to the marketdepth data of our underlying asset. We can execute the query below to fetch the appropriate market depth data:
WITH elw_marketdepth AS (
    SELECT
        isin
        , l1askprice
        , l1asksize
        , l1bidprice
        , l1bidsize
        , (l1askprice + l1bidprice) / 2 AS midprice
        , (l1askprice * l1bidsize + l1bidprice * l1asksize) / (l1asksize + l1bidsize)
            AS weighted_midprice
        , toDate(system_datetime, 'Asia/Seoul') as date
        , toTimeZone(system_datetime, 'Asia/Seoul') as system_datetime
    FROM default.KrxStockWithLPMarketdepth
    WHERE
        toDate(system_datetime, 'Asia/Seoul')='2023-05-26'
        AND
        toTime(system_datetime, 'Asia/Seoul') BETWEEN
            toTime(parseDateTimeBestEffort('09:00:01.0', 'Asia/Seoul'), 'Asia/Seoul')
            AND
            toTime(parseDateTimeBestEffort('15:19:59.0', '{Asia/Seoul'), 'Asia/Seoul')
    AND isin in ({",".join([f"'{isin}'" for isin in elw_isins])})
    ORDER BY system_datetime
)
, underlying_derivative_marketdepth AS (
    SELECT
        isin
        , l1askprice
        , l1asksize
        , l1bidprice
        , l1bidsize
        , (l1askprice + l1bidprice) / 2 AS midprice
        , (l1askprice * l1bidsize + l1bidprice * l1asksize) / (l1asksize + l1bidsize)
            AS weighted_midprice
        , toDate(system_datetime, 'Asia/Seoul') as date
        , toTimeZone(system_datetime, 'Asia/Seoul') as system_datetime
    FROM default.KrxDerivativeL5Marketdepth
    WHERE
        toDate(system_datetime, 'Asia/Seoul')='2023-05-26'
        AND
        toTime(system_datetime, 'Asia/Seoul') BETWEEN
            toTime(parseDateTimeBestEffort('09:00:01.0', 'Asia/Seoul'), 'Asia/Seoul')
            AND
            toTime(parseDateTimeBestEffort('15:19:59.0', '{Asia/Seoul'), 'Asia/Seoul')
    AND isin='KR4101T60006'
    ORDER BY system_datetime
)
, underlying_stock_marketdepth AS (
    SELECT
        isin
        , l1askprice
        , l1asksize
        , l1bidprice
        , l1bidsize
        , (l1askprice + l1bidprice) / 2 AS midprice
        , (l1askprice * l1bidsize + l1bidprice * l1asksize) / (l1asksize + l1bidsize)
            AS weighted_midprice
        , toDate(system_datetime, 'Asia/Seoul') as date
        , toTimeZone(system_datetime, 'Asia/Seoul') as system_datetime
    FROM default.KrxStockMarketdepth
    WHERE
        toDate(system_datetime, 'Asia/Seoul')='2023-05-26'
        AND
        toTime(system_datetime, 'Asia/Seoul') BETWEEN
            toTime(parseDateTimeBestEffort('09:00:01.0', 'Asia/Seoul'), 'Asia/Seoul')
            AND
            toTime(parseDateTimeBestEffort('15:19:59.0', '{Asia/Seoul'), 'Asia/Seoul')
    AND isin='KR4101T60006'
    ORDER BY system_datetime
)
SELECT * FROM elw_marketdepth
UNION ALL
SELECT * FROM underlying_derivative_marketdepth
UNION ALL
SELECT * FROM underlying_stock_marketdepth
ORDER BY system_datetime
Now we are ready to calculate the intraday implied volatility surface.
Intraday Implied Volatility
Below is a python code that iterates over marketdepth data ordered by timestamp, updates the volatility surface, and saves a 5 minute snapshot of the volatility surface:
elw_marketdepth = ELWMarketdepthData(
    date_str,
    elw_data.call_isins + elw_data.put_isins,
    [elw_data.underlying_asset_isin],
    beg_time=beg_time,
    end_time=end_time,
    tz=tz,
    debug=debug
)

call_vol_surfaces = []
put_vol_surfaces = []
next_ts = pd.Timestamp(f"{date_str}T09:05:00.0", tz=tz)
for k, row in enumerate(elw_marketdepth):

    if row["isin"] == elw_data.underlying_asset_isin:
        elw_data.update_underlying_price(row["isin"], row["weighted_midprice"], row["system_datetime"])
    else:
        # elw got updated
        elw_data.update_elw(row["isin"], row["weighted_midprice"], row["system_datetime"])

    if row["system_datetime"] > next_ts:
        next_ts += pd.Timedelta(minutes=5)
        call_vol_surfaces.append(elw_data.call_vol_surface.copy())
        put_vol_surfaces.append(elw_data.put_vol_surface.copy())
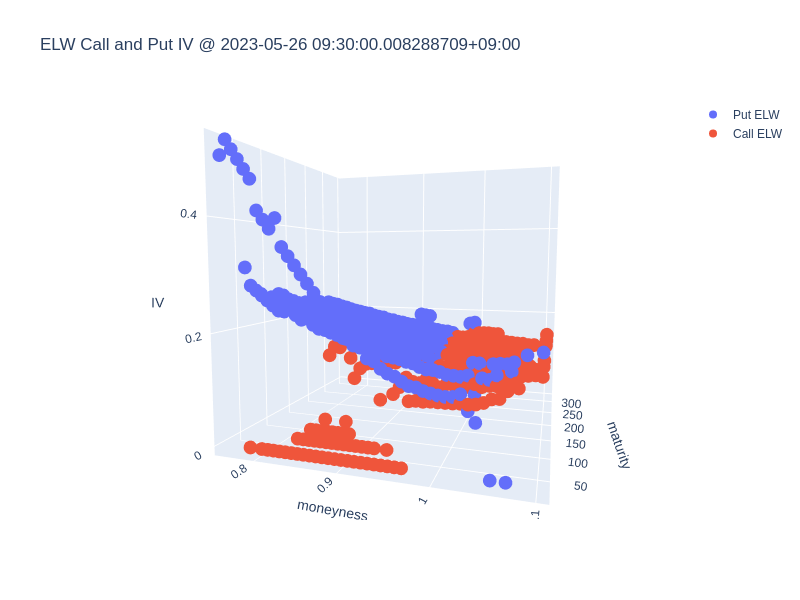
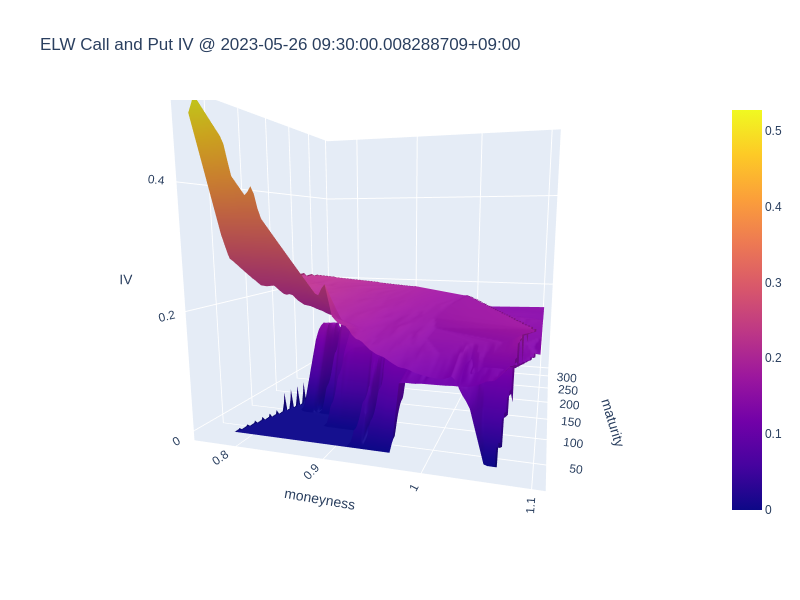
Note that ELWMarketdepthData is a helper class function that fetches the marketdepth data using the aforementioned sql query. You can find the class implementation in the attached python file. Let’s look at some volatility surface at 09:30:00.0 and 15:00:00.0:
It would be interesting to see if we can use the implied volatility, compare it to the realized volatility and create a volatility arbitrage strategy. I will leave this as future work for now.
Leave a comment